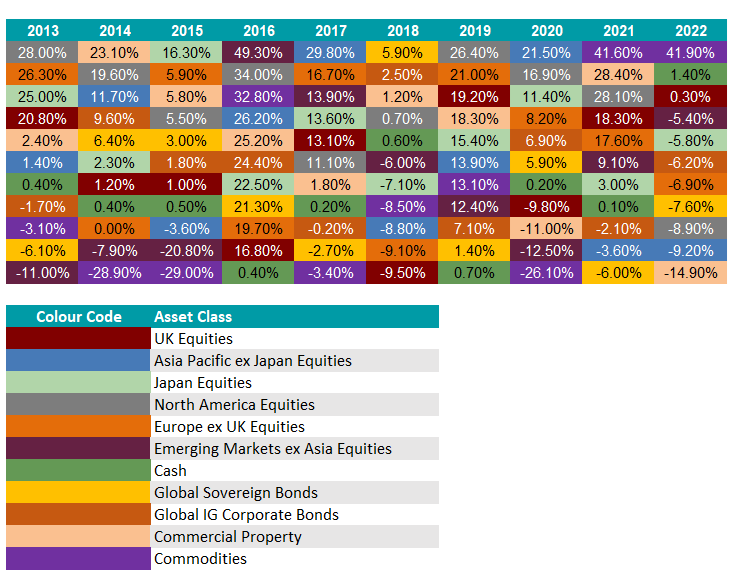
It is almost impossible to predict which asset class will perform better than everything else and to do so consistently; in fact, investors have a better chance of scooping a lottery jackpot.
That’s the conclusion of research by wealth manager RBC Brewin Dolphin, which found that the odds of picking the top performer from 11 asset classes for 10 years in a row are one in 25 billion.
By narrowing that down to a universe of seven main asset classes, the odds reduce considerably to one in 282 million but, to put that into context, there’s a one in 140 million chance of winning the EuroMillions lottery jackpot.
The best asset classes change around almost annually, which makes it even harder to forecast which strategies might win out.
The only investment that managed to beat everything else for two years in a row is commodities. They were the best performing asset class in 2021 and 2022 but they are too volatile to be seen as a long-term store of value; they underperformed everything else in 2014, 2015, 2017 and 2020.
Asia Pacific equities were the place to be in 2020 and 2017. North American stocks ruled the roost in 2019, 2013 and, if their run continues, this year as well. Global sovereign bonds reigned supreme in 2018 while Japan, which has enjoyed a strong rally this year, was the best performer in 2015. Commercial property had a resurgence in 2014.
Last year was particularly tough for investors. All asset classes lost money except for commodities, cash and UK equities (the FTSE All Share was more or less flat, up 0.3%).
The gap between the best and worst performers in 2022 was the largest investors have seen for at least 10 years. Commodities delivered an impressive 41.9% while commercial property lost 14.9% – a gap of 56.8%. The difference between the top and bottom asset classes averaged out at 41% during the past 10 years.
Asset class total return performance 2013-2022:

Source: RBC Brewin Dolphin, Bloomberg
Rob Burgeman, senior investment manager at RBC Brewin Dolphin, said: “If you’re investing, you need to be in it for the long haul. We often say that five years is the minimum time horizon, but in reality you want to be looking at more like 10 years or ideally longer. As the old saying goes, it is time in the market, not timing the market that makes the difference.
“The spread in the performance of asset classes over the last decade highlights the near impossibility of being able to predict what will happen in the future. That is why we advocate diversification for investment portfolios, which ensures you see some – but not all – of the benefit of what does well, while protecting yourself against the worst effects of the laggards at any given time.”


